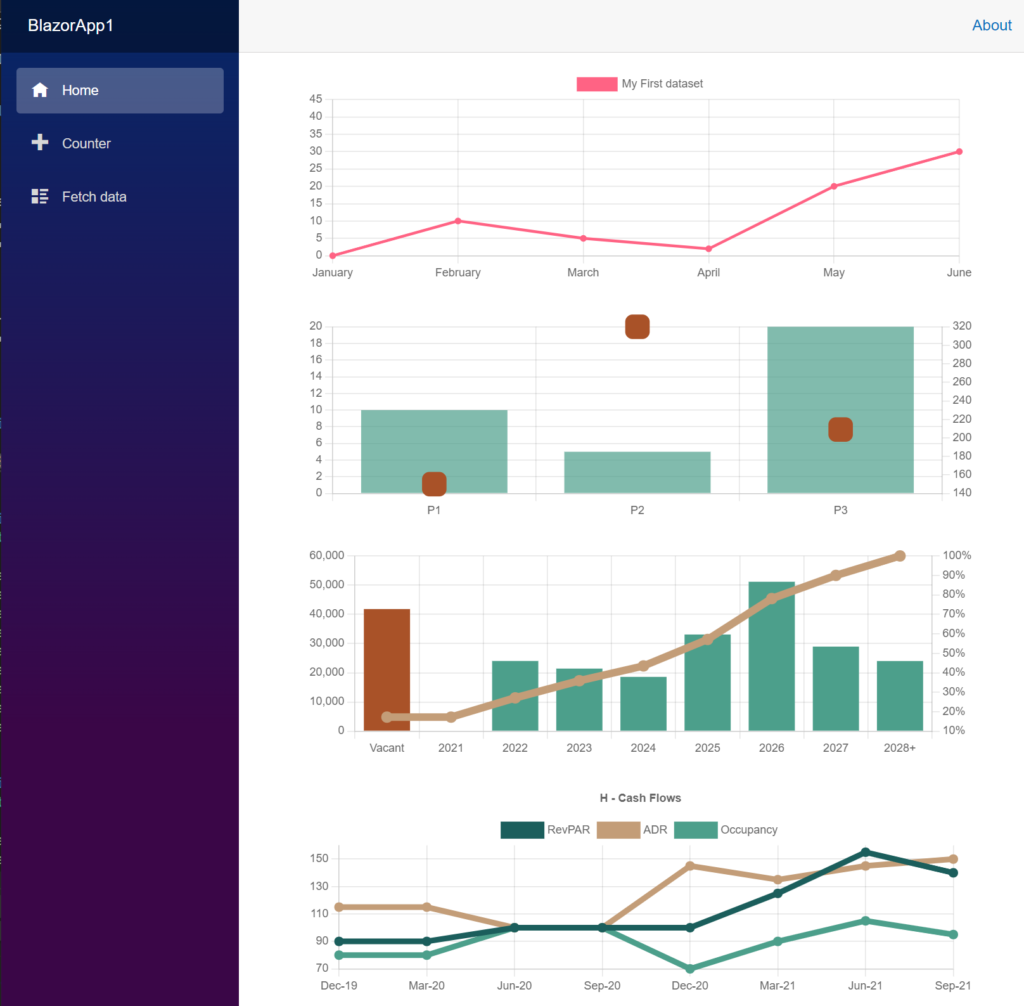
I recently had to implement some multi axis charts in a Blazor project for a client, I started using an open source nuget package but it hadn’t been updated in over 12 months and the documentation was very limited. It was ok for simple graphs but when things got more complicated the cracks started to show.
ChartJS has a mind boggling array of options to configure, even the official documentation doesn’t quite seem to cover all combinations. It’s also constantly getting new features added which tells me a Blazor native wrapper componet will be next to impossible to maintain, so I’d need to find a solution that was closer to the real Javascript version.
Eventually I found this interesting blog post where he uses an anonymous type to pass in the chart config to the Javascript side without requiring much Javascript interop code.
I used my own implementation using that concept for my client and it’s working really well (see below), I’ve posted a sample and documented how to do it over in this github repo.

How would you access the properties in the YAxes array. Using your code the anonymous type properties don’t seem to map to the JS properties.
Hello, this is very interesting. I wonder though if you have experience (or thoughts…) on implementing event handlers, like clicking a pie chart click event, with this approach.